Real-Time MonitoringEnterprise
Monitor your factory from anywhere
Connect IoT sensors to your 3D digital twin. Display live data as colored particles directly on the model, with real-time graphs to track what matters.
Connect your sensors
Define a data source, bind it to a room or volume in your 3D model, and live data starts flowing. No custom dashboards to build — the factory model is the dashboard.
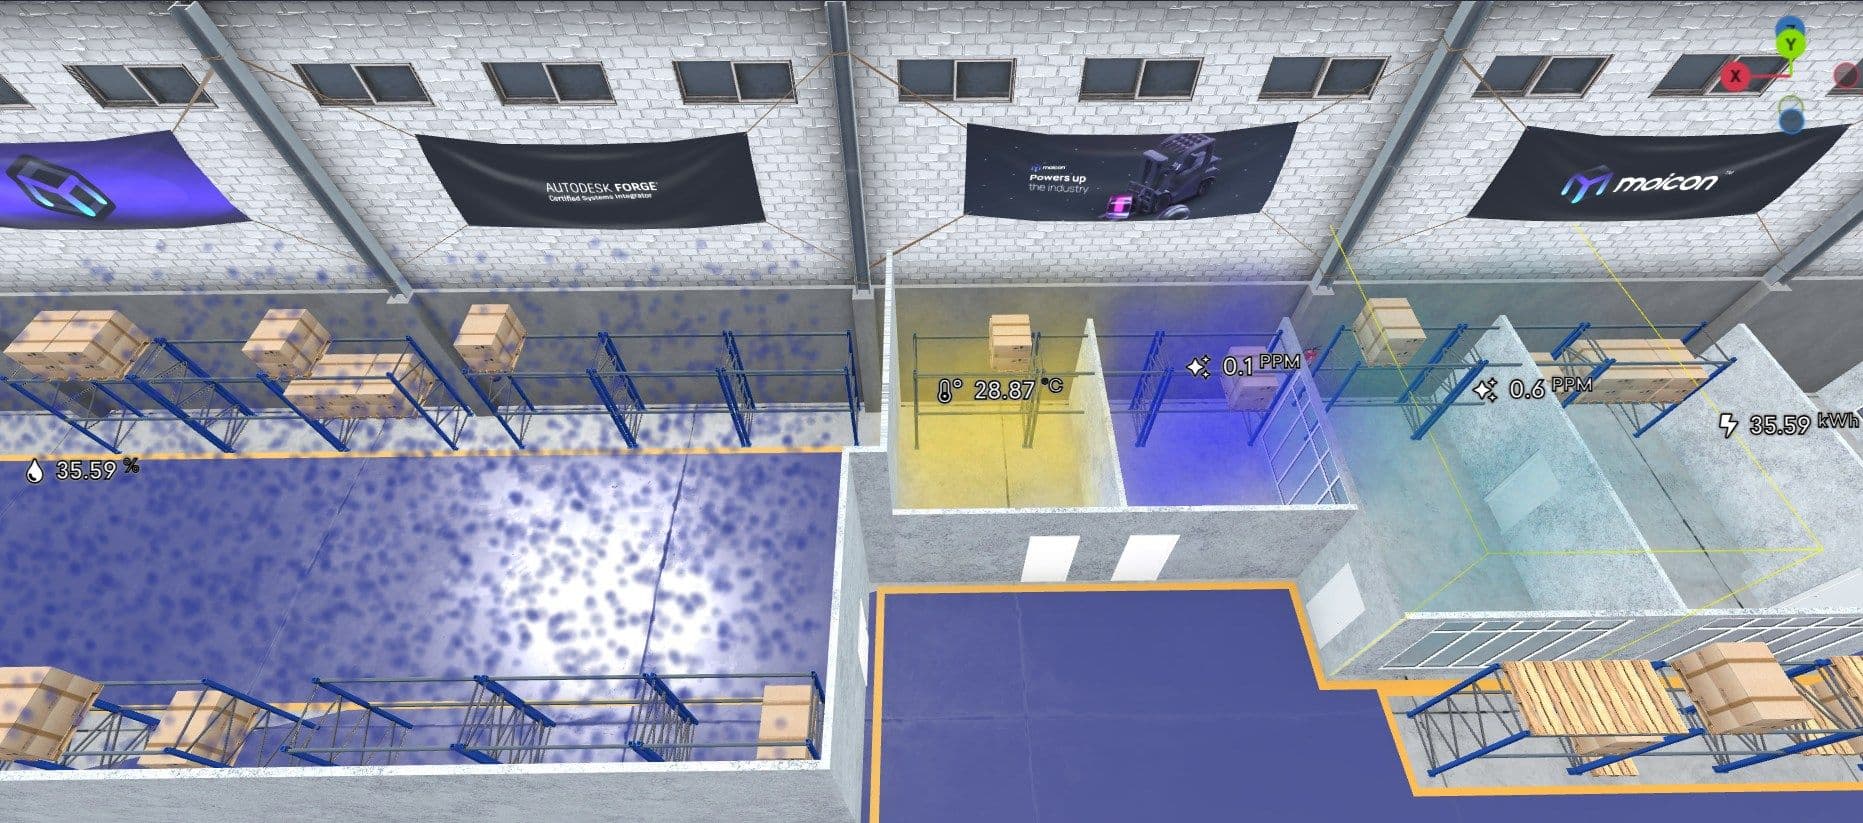
3D and 2D data visualization
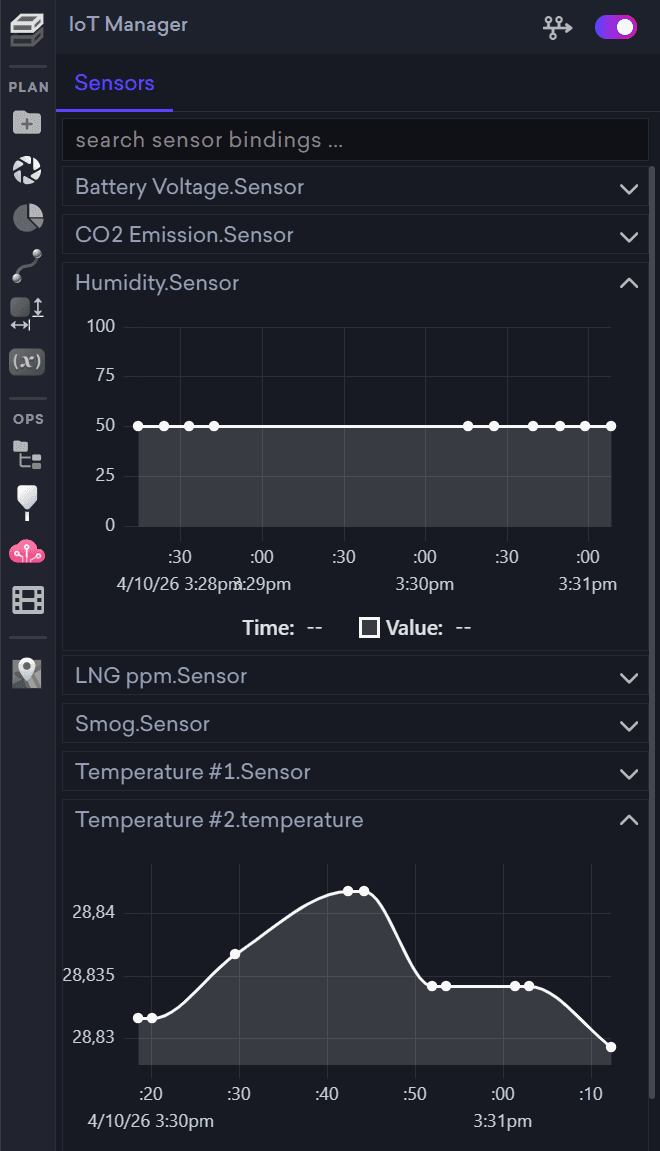
Temperature, humidity, power consumption — whatever your sensors measure, see it rendered as particles and colors directly on your 3D model. Real-time graphs let you track trends, All within the Moicon Platform.
Data bindingLink any sensor endpoint to a specific room, volume, or machine in your model.
Rooms & VolumesOrganize your factory into spatial zones that map to real-world areas and equipment.
Particle visualizationSensor values rendered as particle density and flow on the model surface.
Real-time graphsLive-updating charts for every connected sensor, visible alongside the 3D view.
Threshold controlsAdjust particle density and color ranges to highlight the readings that matter.